About This Club
Crypto Trading Definitions
🔹 Crypto Analysis (Technical & Fundamental):
Crypto analysis refers to the evaluation of digital assets based on technical indicators, chart patterns, and fundamental data to predict future price movements.
🔹 Trading Signals:
Trading signals are buy or sell recommendations based on market trends, indicators, or algorithmic analysis. These signals help traders make informed decisions in futures and spot markets.
🔹 Futures Trading:
Futures trading involves leveraged contracts that allow traders to speculate on the future price of a cryptocurrency without owning the asset. It includes:
✅ Long Positions – Betting on price increase
✅ Short Positions – Betting on price decrease
✅ Leverage – Multiplying gains & risks
🔹 Spot Trading:
Spot trading refers to buying and selling cryptocurrencies at the current market price for immediate settlement. Unlike futures, no leverage is used, and traders own the actual asset.
⚡ Key Differences:
Futures trading allows leverage & shorting but carries higher risk.
Spot trading is safer but lacks leverage opportunities.
🚀 Successful trading requires proper risk management and market analysis!
- What's new in this club
-
Bitcoin (BTC/USDT) Technical Analysis (2H Chart - Binance)
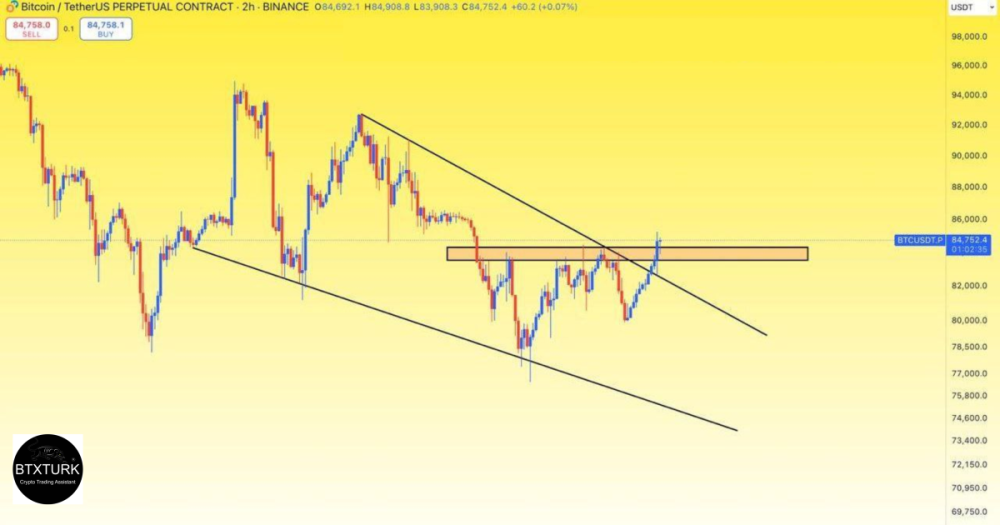
Bitcoin (BTC/USDT) Technical Analysis (2H Chart - Binance)This chart presents a Bitcoin price analysis within a falling wedge pattern. The technical breakdown suggests two potential scenarios: a rejection and drop or a breakout after a retracement. Below is a detailed analysis: 1️⃣ Chart Structure & TrendlinesDescending Channel (Falling Wedge Formation) Bitcoin is moving within a downward-sloping channel, indicated by two black trendlines. This pattern is generally bullish when a breakout occurs, but for now, BTC remains inside the structure. Resistance & Support Levels Resistance (~83,700 - 84,000 USDT) BTC is currently approaching the upper boundary of the descending channel. The highlighted resistance box suggests a strong rejection zone. Support (~78,000 - 80,000 USDT) There is a key demand zone around 78,000 USDT, where BTC has bounced previously. A further drop could push the price to 72,000 USDT, aligning with the lower channel support. 2️⃣ Bearish Scenario (Rejection & Drop)If BTC fails to break the resistance, a rejection may cause: Initial drop to ~80,000 USDT (first support) Further decline to 78,000 USDT, possibly testing the lower trendline If selling pressure increases, BTC could touch 72,000 USDT before rebounding. The black arrows indicate the potential path of BTC towards lower supports. 3️⃣ Bullish Scenario (Breakout & Recovery)If BTC breaks above the resistance (~84,000 USDT): A retest of 86,000 - 88,000 USDT could follow. A full breakout from the wedge could push BTC beyond 92,000 USDT. However, the chart suggests BTC might first retest lower levels before a bullish move. 4️⃣ Market Sentiment & Key Levels to Watch📌 Resistance: 84,000 USDT (critical breakout point) 86,000 - 88,000 USDT (bullish confirmation) 📌 Support: 80,000 USDT (short-term support) 78,000 USDT (key zone) 72,000 USDT (major demand zone) Conclusion & Strategy✅ If BTC breaks 84,000 USDT → Bullish Continuation ❌ If rejected → Bearish move toward 78,000-72,000 USDT Currently, Bitcoin is at a decision point near the resistance. Traders should wait for confirmation before making moves. Uploading Attachment...
-
Key Observations:2
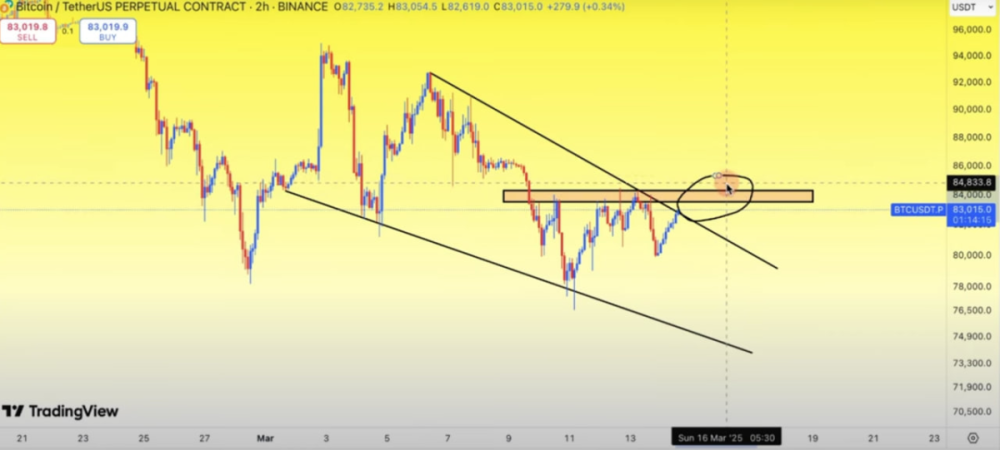
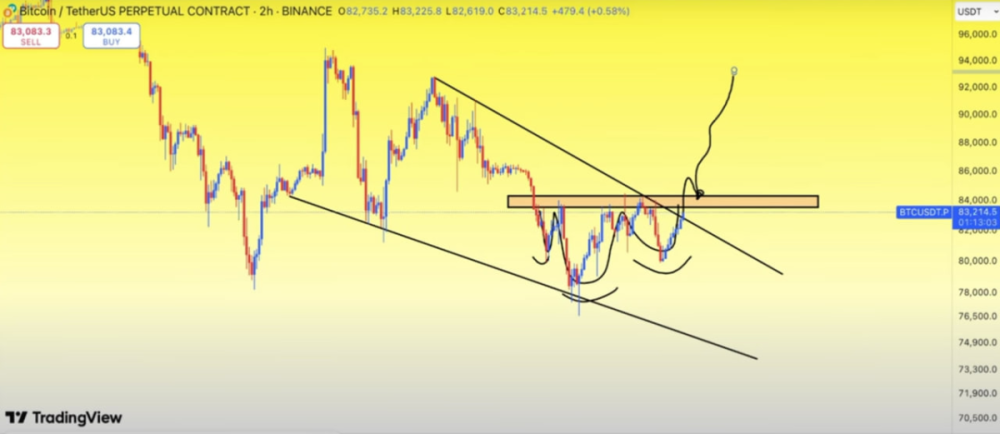
Key Observations:Descending Channel Formation: The price has been moving inside a falling wedge (downward-sloping channel), marked by two black trend lines. This suggests a bearish structure, but such patterns often result in bullish breakouts when resistance is broken. Support and Resistance Zones: Resistance Zone (~83,600 - 84,000 USDT) The price is currently testing the upper boundary of the descending channel. This area has acted as strong resistance multiple times. Support Zones (~78,000 USDT & ~73,500 USDT) The lower support levels have been respected multiple times, making them critical in case of a rejection. Breakout Indication: Unlike the previous chart (which suggested a potential drop), this one now indicates a breakout scenario. A black curved line is drawn, suggesting an upward movement above the descending trendline. If BTC breaks and holds above this resistance, it could signal a trend reversal toward a bullish scenario. Potential Price Targets: The breakout could lead BTC to test 86,000 - 88,000 USDT (next resistance zone). If momentum continues, BTC might even push toward 92,000+ USDT. Current Market Position: The price is trading at 83,600.1 USDT, just below the resistance zone. Bulls need to confirm the breakout by holding above the descending trendline. Conclusion:Bullish Scenario: A successful breakout above 84,000 USDT could push BTC toward 86,000 - 88,000 USDT and beyond. This would indicate a shift in trend from bearish to bullish. Bearish Rejection: If BTC fails to break out, a rejection could bring the price back to 80,000 USDT and possibly lower to 73,500 USDT. Key Levels to Watch: Breakout Level: ~84,000 USDT Target Levels: ~86,000 USDT → ~88,000 USDT → ~92,000 USDT Support Levels: ~78,000 USDT → ~73,500 USDT Uploading Attachment...
-
Key Observations:
This chart represents a technical analysis of Bitcoin (BTC/USDT) on Binance using a 2-hour timeframe. Below is a detailed breakdown of the chart elements and their implications: Key Observations:Descending Channel Formation: The price action is moving within a downward-sloping channel, marked by two black trend lines. This pattern indicates a bearish trend where the price is continuously making lower highs and lower lows. Support and Resistance Zones: Resistance Zone (Highlighted Rectangle at ~84,000 USDT): The price has attempted to break above this zone multiple times but has been rejected. This suggests strong selling pressure at this level. Support Zones (Highlighted Rectangles at ~73,500 USDT and ~71,000 USDT): These areas have been identified as potential support levels where buyers may step in. If the price breaks below these levels, further downside can be expected. Projected Price Movement (Black Curved Lines): The chart suggests a bearish continuation with possible bounces from the lower support levels. A potential drop to around 73,500 USDT is expected. If the price breaks this level, it might test lower supports around 71,000 USDT. After reaching these lower support levels, a possible reversal or bullish reaction may occur. Current Price Position: The current price is 83,643.7 USDT, trading near resistance. If it fails to break this resistance, a downward move is likely. Trend Implications: The descending structure suggests that Bitcoin is in a correction phase. A breakout above the resistance could invalidate the bearish scenario and lead to bullish momentum. Conversely, if Bitcoin continues to get rejected at resistance, a drop toward 73,500 USDT and possibly lower levels could occur. Conclusion:Bearish Scenario: Price follows the projected black line, drops to support (~73,500 USDT) before bouncing. Bullish Breakout: If Bitcoin breaks above the resistance (~84,000 USDT), a move toward 86,000-88,000 USDT could happen. Key Levels to Watch: Resistance: 84,000 - 85,000 USDT Support: 73,500 USDT, 71,000 USDT Potential lower target: 67,000 USDT (if support fails) This analysis suggests caution in the current market structure, with a preference for short positions unless a clear breakout occurs.
-
🚀 SPOT Trading Signal! 🚀
🚀 AWESOME PROFIT! 🚀 💎 Our #OPEN/USDT transaction exceeded targets and reached 0.005831! 📈🔥 🎯 Entry Level: 0.00122 🏆 Profit to the Last Level: 378% 🚀💰 Those who took advantage of this opportunity increased their investments by 4.78x! 🎉🎯 📊 Technical analysis continues to win! Stay tuned for more opportunities! 🚀🔥
-
BTC Dominance (BTC.D) 4H Chart Analysis
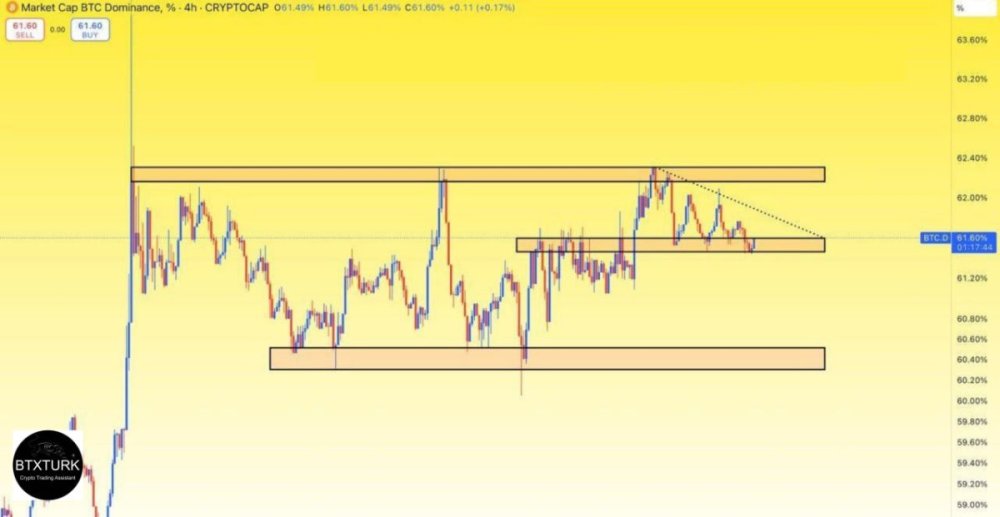
BTC Dominance (BTC.D) 4H Chart Analysis 📊 Bitcoin Dominance is at a Key Decision Point! 📊 🔹 Current BTC.D: 61.60% 🔹 Resistance Zone: 62.00% - 62.40% 🔹 Support Zones: ✅ Immediate Support: 61.40% ✅ Major Support: 60.40% 📉 Bearish Scenario: BTC Dominance is forming a descending triangle pattern, indicating a potential breakdown if support fails. A break below 61.40% could trigger a further drop towards the 60.40% major support zone. This could signal strength in altcoins, as capital flows out of BTC. 📈 Bullish Scenario: If BTC.D manages to hold above 61.40% and breaks the descending trendline, we could see a move towards 62.40%. A breakout above 62.40% could push BTC dominance towards new highs, potentially weakening altcoin momentum. 🚀 Key Levels to Watch: 🔸 Breakout Above 62.40% → BTC Strengthens, Alts Suffer 🔸 Breakdown Below 61.40% → Altseason Incoming? 🔥 Stay tuned for the next move! Do you think BTC dominance will break up or down? Comment below! 👇 #BTC #BitcoinDominance #CryptoAnalysis #Altcoins
-
🚀 SPOT Trading Signal! 🚀
🚀 SPOT Trading Signal! 🚀 💎 #OPEN/USDT 💎 🎯 Entry Level: 0.00122 🔥 Profit Targets: ✅ 1. 0.00138 ✅ 2. 0.00171 ✅ 3. 0.00183 ✅ 4. 0.00217 ✅ 5. 0.00356 ⚠️ Stop Level: 0.000789 ⏳ Don't miss the opportunity! 🚀📈
-
Bitcoin (BTC/USDT) Teknik Analizi (2H Grafik - Binance)
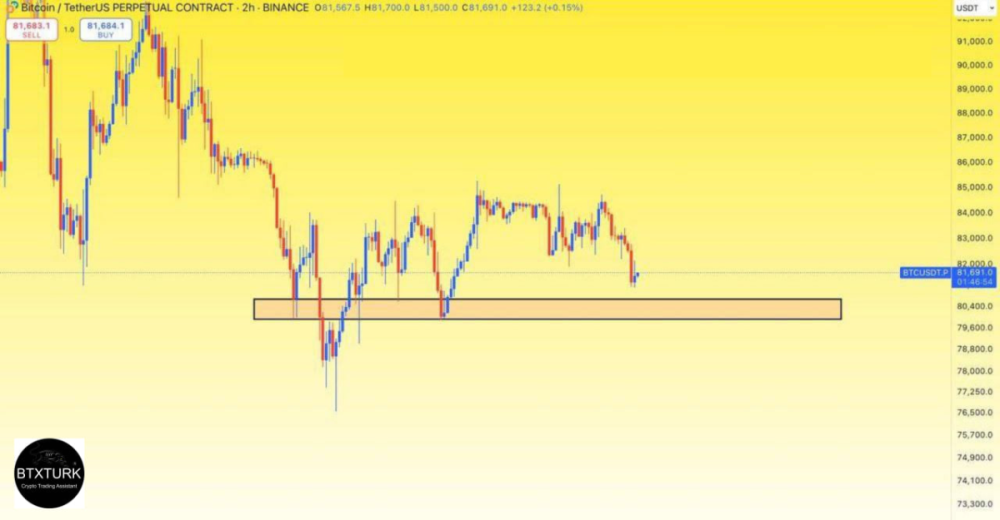
Bitcoin (BTC/USDT) Technical Analysis (2H Chart - Binance)1. Price Action & Market StructureThe chart displays Bitcoin’s price movement on a 2-hour timeframe. Current price: **$81,691 Recent price range: **$81$81,500 (low) – $81,700 (high) The price is currently in a downtrend,lower highs and lower lows. A key support zone is highlighted$79,600 – $80,400, wstrong demand area. 2. Key Support & Resistance LevelsSupport Zone (Demand Area): $79,600 – $80,400 (Highlighted Box) This zone has historically acted as a strong support, leading If the price holds above this area, a bounce toward resistance levels is likely. A breakdown below this zone may trigger further downside pressure. Immediate Resistance: $82,500 – $83,000 Bitcoin has faced rejection multiple times in this region. A confirmed breakout above this zone could lead to a rally toward $85,000 – $87,000. Major Resistance Levels: $85,000 – $86,500 (Key $88,000 – $90,000 ( 3. Trend Analysis & Technical IndicatorsCandlestick Patterns: Recent candles show rejections at higher levels,selling pressure. A bullish engulfing candle near the Trend Direction: The short-term trend is bearish, but$79,600 – $80,400 support zone Liquidity Zones: There is a possibility of a liquidity grab near the support area before a significant move. Potential Bearish Breakdown: If the price falls below $79,600, it could lead to further selling. Next support levels: $77,250 – $78,000 $75,000 – $76,000 4. Potential Scenarios & Trading StrategiesBullish Scenario (Bounce from Support)If Bitcoin respects the $79,600 – $80,400 zone, a bounce toward the $82,500 – $83,000 resistance is likely. A break and close above $83,000 could trigger a rally toward: $85,000 – $86,500 $88,000 – $90,000 (strong psychological level) Bearish Scenario (Break Below Support)If Bitcoin breaks below $79,600, expect further downside. Next downside targets: $77,250 – $78,000 (first major support) $75,000 – $76,000 (stronger demand zone) Bearish confirmation: A high-volume breakdown below $79,600. Retest failure of support as resistance. 5. Market Sentiment & ConclusionKey Level to Watch: $79,600 – $80,400 (support zone) Market Sentiment: Neutral to Bearish Trading Strategy: Long Position: If price shows a bullish reaction near support. Short Position: If price breaks below $79,600 with strong volume.
-
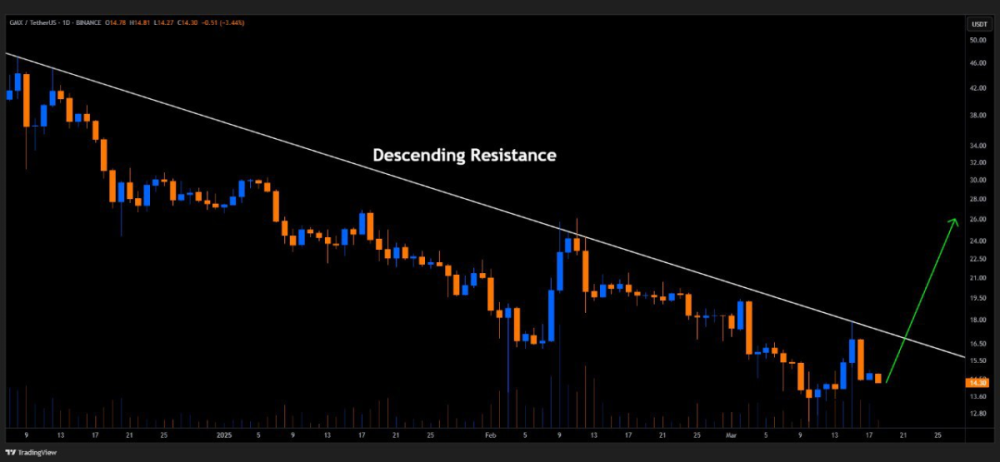
GMX/USDT – Daily Chart Analysis
GMX/USDT – Daily Chart AnalysisOverview:The chart represents GMX vs. Tether (USDT) on Binance (1D timeframe). The price is currently trading at $14.30, showing a prolonged downtrend. A descending resistance line is acting as a strong barrier to price recovery. Key Observations:Descending Resistance Line: The price has been consistently rejected at this trendline. This descending resistance needs to be broken for a bullish reversal. Potential Breakout Setup: If GMX successfully breaks above the descending resistance, a strong bullish move could follow. The green arrow suggests a breakout target around $25-$26, which aligns with previous key levels. Current Support Levels: The recent bounce from $13-$14 suggests buyers are defending this zone. If the price fails to break resistance, another retest of support levels is likely. Bullish vs. Bearish Scenarios: Bullish: A breakout above resistance could trigger a strong rally toward $20-$25. Bearish: If the resistance holds, GMX may continue its downtrend or retest support at $12-$13. Trading Strategy: Breakout traders should watch for a confirmed daily close above resistance with strong volume. Risk management is crucial, with stop-loss placements below recent support levels. Conclusion:GMX is approaching a key decision point. If it breaks the descending resistance, a strong bullish rally toward $25+ could unfold. However, failure to break above could lead to further downside pressure. Traders should watch for confirmation signals before entering positions.
-
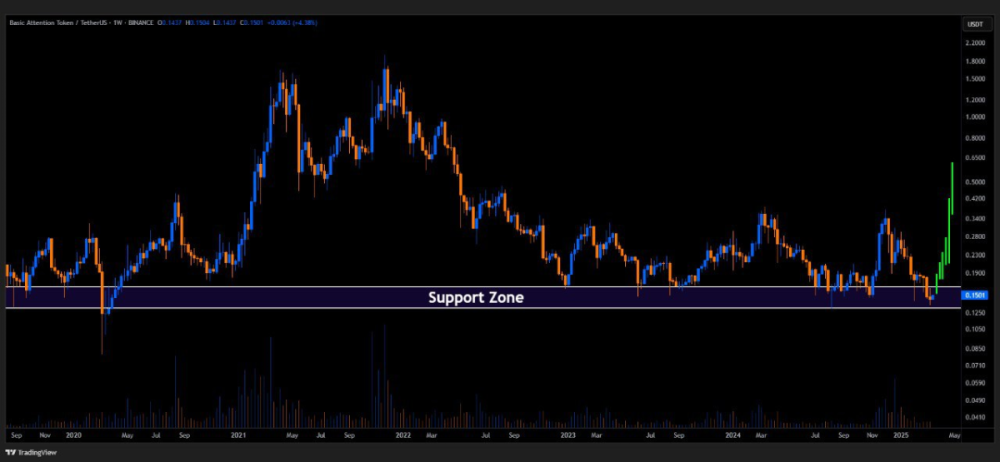
Basic Attention Token (BAT/USDT) – Weekly Chart Analysis
Basic Attention Token (BAT/USDT) – Weekly Chart AnalysisOverview:The chart represents Basic Attention Token (BAT) vs. Tether (USDT) on Binance (1W timeframe). The current price is $0.1501, with a strong bounce from the identified support zone. The token has experienced a significant price surge, breaking above key resistance levels. Key Observations:Major Support Zone: The highlighted support zone has historically acted as a strong demand area, preventing further downside. This level has held multiple times since 2020, confirming it as a key accumulation zone. Recently, the price bounced strongly from this level, signaling renewed buying interest. Breakout & Bullish Momentum: Following the retest of the support zone, BAT has exploded upwards with strong bullish candles. The sharp increase in volume indicates growing interest and accumulation. This breakout suggests a potential trend reversal or at least a medium-term rally. Next Resistance Levels: The price has already gained strong momentum, but some potential resistance zones to watch: $0.35 - $0.40 → Previous consolidation area. $0.50 - $0.60 → Psychological resistance and past key levels. $1.00+ → If the bullish momentum continues, a return to the 2021 highs could be possible. Market Sentiment & Strategy: The strong breakout and volume surge suggest continuation towards higher levels. A healthy pullback or retest of previous breakout levels could present good re-entry opportunities. Traders should monitor weekly closes to confirm sustained momentum. Potential Trade Setups:Bullish Scenario: If momentum continues, BAT could test $0.35 - $0.40 in the short term. A successful breakout above $0.50 could open doors for a rally toward $1.00 in the coming months. Bearish Scenario: If BAT faces rejection at higher resistance, a pullback to $0.20 - $0.25 may offer a better entry point. Losing the support zone (~$0.12 - $0.15) would invalidate the bullish structure, leading to further downside risks. Conclusion:BAT has made a strong recovery from its long-term support zone, signaling bullish momentum. If the trend continues, the next key resistance zones ($0.35 - $0.50) could be tested soon. However, traders should watch for possible pullbacks for better entries.
-
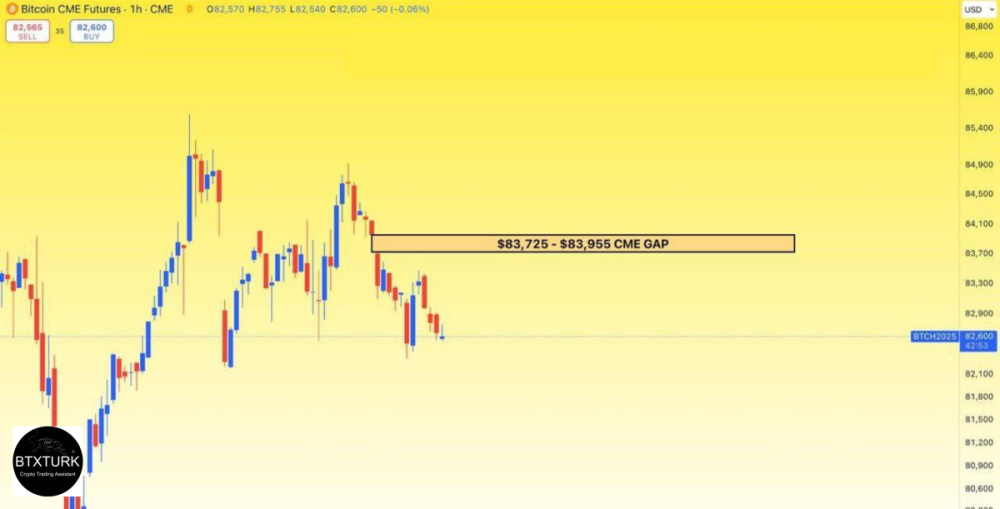
Bitcoin CME Futures – 1H Chart Analysis
Bitcoin CME Futures – 1H Chart AnalysisOverview:The chart represents the Bitcoin CME Futures (1-hour timeframe). The current price is $82,600. There is an identified CME gap between $83,725 - $83,955. Key Observations:CME Gap Formation: A CME gap occurs when there is a price difference between the market close on Friday and the opening price on Sunday. The highlighted zone ($83,725 - $83,955) represents an unfilled gap, a common phenomenon in Bitcoin CME futures. Current Price Action: Bitcoin is currently trading at $82,600, below the CME gap. The price has been experiencing high volatility, with strong bullish and bearish movements. Technical Levels: Resistance: The primary resistance zone is at the CME gap level ($83,725 - $83,955). Support: Key support levels are $82,000 and $81,500, where price may find stability before attempting an upward move. Market Sentiment & Strategy: Historically, CME gaps tend to get filled, meaning Bitcoin may move towards the $83,725 - $83,955 range. If price breaks above $83,955, we may see further bullish continuation. However, if Bitcoin fails to reclaim the gap, a retracement towards $82,000 or lower is possible. Potential Trade Setups:Bullish Scenario: If BTC starts gaining momentum, traders may look for long positions targeting the CME gap fill. Bearish Scenario: If rejection occurs at resistance, short opportunities towards $82,000 - $81,500 could emerge. Conclusion:Bitcoin's CME gap remains a crucial level to watch. Traders should monitor price action around $83,725 - $83,955 for potential movement. A breakout above the gap may trigger further upside, while failure to reclaim could lead to a pullback.
-
🔥 EXF/USDT made a big rise!
🚀 TARGET 3 REACHED! 🎯💰 🔥 EXF/USDT made a big rise! ✅ Entry Price: 0.00018475 🚀 Realized Price: 0.00295602 💥 Total Profit: 1,500%+ 📈🔥 Continue to follow the channel so you don't miss such opportunities! 📢💎
-
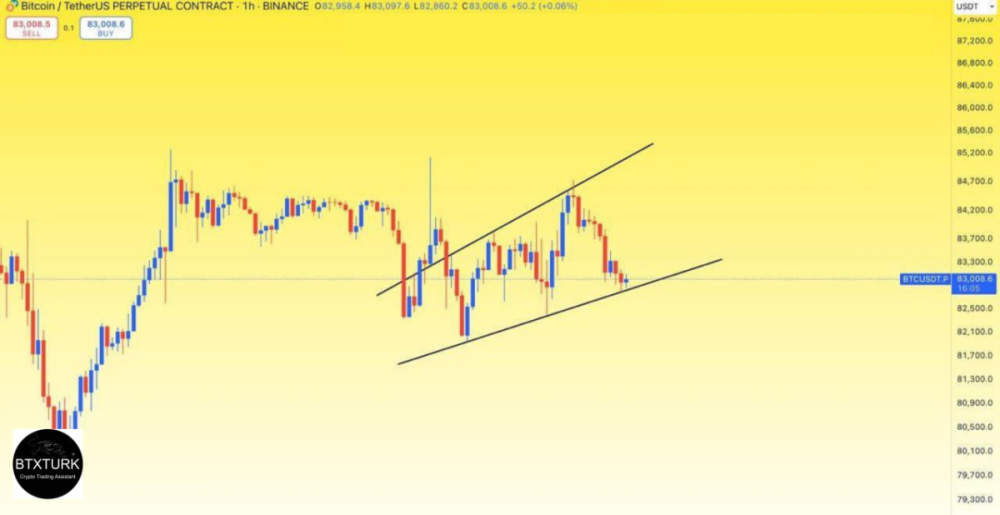
📊 Bitcoin (BTC/USDT) Technical Analysis – 1H Chart 🚀
📊 Bitcoin (BTC/USDT) Technical Analysis – 1H Chart 🚀 Bitcoin is currently trading within an ascending channel on the 1-hour timeframe, showing a structure of higher highs and higher lows. 🔹 Support Level: The price is testing the lower boundary of the channel ($83,000). If this level holds, we could see a bounce towards the upper trendline. 🔹 Resistance Level: The upper boundary of the channel ($84,500 - $85,000) remains a key resistance area. 🔹 Breakout Scenario: A bullish breakout above the upper trendline could signal continuation towards $86,000+. A bearish breakdown below the channel could bring a drop toward $82,000 - $81,500 support levels. 📈 Watch for a reaction at the current support level – a strong bounce could provide long opportunities, while a breakdown may confirm short-term bearish momentum! 🔔 Stay tuned for further updates! #Bitcoin #BTC #CryptoAnalysis 🚀
-
🚀 Bitcoin Price Action – Bullish Breakout in Play! 🔥
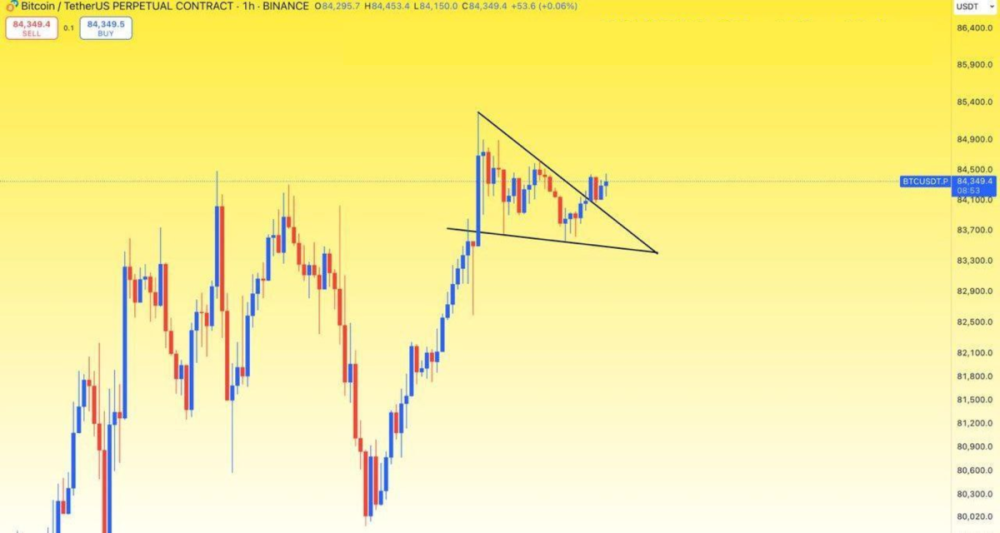
🚀 Bitcoin Price Action – Bullish Breakout in Play! 🔥 🔹 Chart Overview: This is the 1-hour BTC/USDT perpetual contract chart from Binance. We can see that Bitcoin recently formed a bullish pennant pattern after a strong upward move. The price has now broken out of the pattern, indicating potential continuation to the upside. 🔹 Key Observations: ✅ Bullish Pennant Breakout: The pattern shows higher lows and lower highs, forming a converging triangle structure. BTC has successfully broken above the upper trendline, suggesting bullish momentum. Volume confirmation is crucial for further upside movement. ✅ Support & Resistance Levels: Support: The 84,150 – 84,300 zone should now act as support after the breakout. Resistance: The next target levels for BTC are 84,700 and 85,400, with a possible continuation to 86,000. ✅ Bullish Scenario: If BTC sustains above 84,300, we could see strong bullish continuation. A break above 85,000 would trigger FOMO buying, leading to new local highs. ✅ Bearish Scenario: If BTC fails to hold above 84,300, we might see a pullback towards 83,700. A break below 83,500 could invalidate the bullish setup and shift momentum to the downside. 🔹 Conclusion & Trading Strategy: 📌 Watch for strong volume confirmation above 84,300 for potential long trades. 📌 Bulls need to push above 85,000 for further continuation. 📌 If BTC dips below 83,700, caution is advised as the pattern could invalidate. #BTC #Bitcoin #Crypto #TechnicalAnalysis 🚀
-
🚀 BTC Dominance Analysis – Important Levels to Watch! 🔥
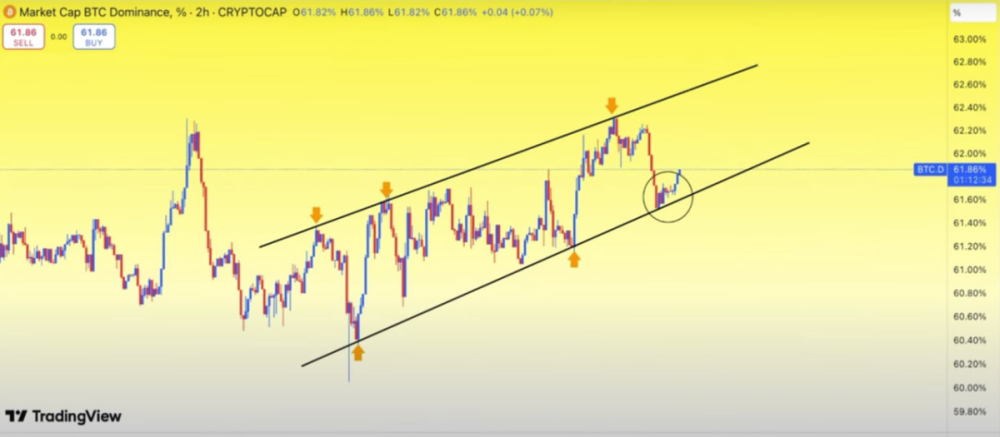
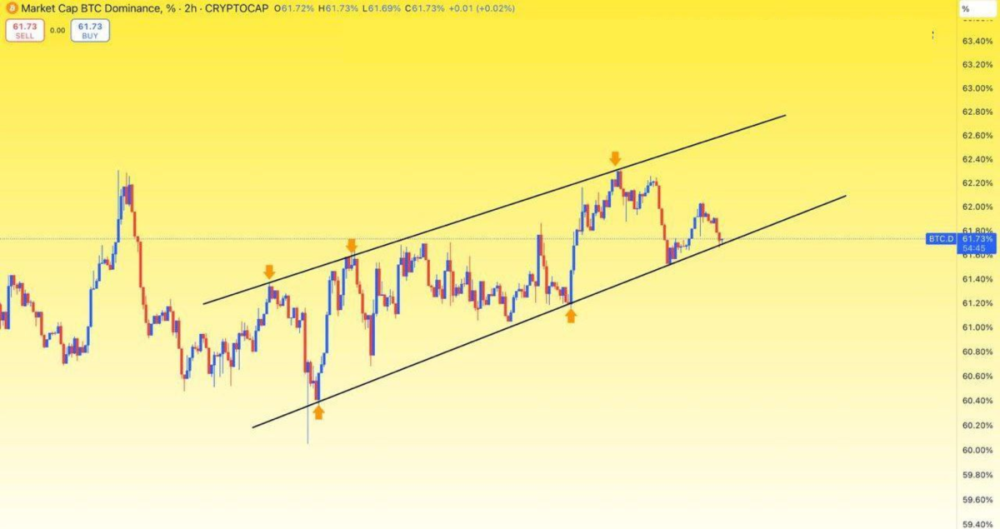
🚀 BTC Dominance Analysis – Important Levels to Watch! 🔥 🔹 Chart Overview: This is a 2-hour BTC Dominance chart, and we can see that BTC dominance is currently trading inside an ascending channel. The price has been respecting both the upper and lower trendlines consistently. 🔹 Key Observations: ✅ Support & Resistance Levels: BTC dominance is currently testing the lower trendline of the channel (around 61.73%). The upper resistance zone is around 62.80%, which has been tested multiple times. The lower support zone is around 61.50% – 61.60%, which has provided strong support in the past. ✅ Bullish Scenario: If BTC dominance bounces from this support, we could see another move towards the upper trendline, targeting 62.50% – 62.80%. Breaking above 62.80% would indicate strong BTC dominance, possibly leading to further correction in altcoins. ✅ Bearish Scenario: If BTC dominance breaks below 61.50%, we could see a drop to 61.00% or even lower, which may result in a potential altcoin rally. A breakdown from this ascending channel would indicate a shift in market dynamics, giving altcoins more strength. 🔹 Conclusion & Trading Strategy: 📌 Watch for a strong bounce from the lower trendline for a possible long position on BTC dominance. 📌 If BTC dominance drops below the channel, altcoins could start gaining momentum. 📌 Keep an eye on BTC price action as well, since BTC dominance movements directly impact the altcoin market.
-
🎁FREE SPOT TRADING SIGNAL #REVA/USDT
✅FREE SPOT TRADING RESULT #REVA/USDT Entry Price: 0.014713 Market Price: 0.034500 🔝 Total Profit - 135%🔥
-
BTC Has Been Completely Broken As We Explained In Our Previous
#BTC Has Been Completely Broken As We Explained In Our Previous Analysis, The Retest Process Is Currently Continuing. When The Retest Is Successful, We Can See A Good Rise In BTC 🚀
-
✅ Ideal Scenario for Buying:
✅ Ideal Scenario for Buying: 1️⃣ The Falling Wedge formation should be broken upwards. 2️⃣ A strong retest should come at $84,000. 3️⃣ A long position can be opened after closing above $84,000. 🎯 🚨Things to watch out for: If BTC cannot break the $84,000 level and the selling pressure increases, there is a possibility of a pullback. It is important to determine stop-loss levels and trade. Result and Strategy: 🚨The important resistance level for BTC is $84,000, if this level is broken, the rise may accelerate. If BTC Dominance continues to rise, risks in the altcoin market increase. It is important to follow the breakout and retest process before opening a position. Not Investment Advice.
-
#BTC Dominance Analysis
#BTC Dominance Analysis #BTC Dominance is receiving a reaction from the trend line support in the chart, as we stated in our Telegram channel in the morning. If #BTC Dominance rises, the altcoin market may see declines. Investors need to follow #BTC Dominance carefully. If Dominance continues to rise sharply, the altcoin market may see steep declines. Not Investment Advice.
-
Bitcoin Technical Analysis (2-Hour Chart)
Bitcoin Technical Analysis (2-Hour Chart) #BTC is currently trading at $83,000. A falling wedge formation has formed on the chart. This formation usually gives a bullish (bullish) signal. BTC is currently trying to break the resistance zone of this formation. However, there is a risk for investors who enter early! Many people open long positions by seeing only the trend line break. However, the real important resistance level is located just above as a horizontal resistance. For a solid rise, both the falling wedge and the horizontal resistance must be broken.
-
🎁FREE SPOT TRADING SIGNAL #REVA/USDT
✅FREE SPOT TRADING RESULT #REVA/USDT Entry Price: 0.014713 Market Price: 0.024100 🔝 Total Profit - 64% 🔥
-
Bitcoin Dominance Analysis (4H) 📊
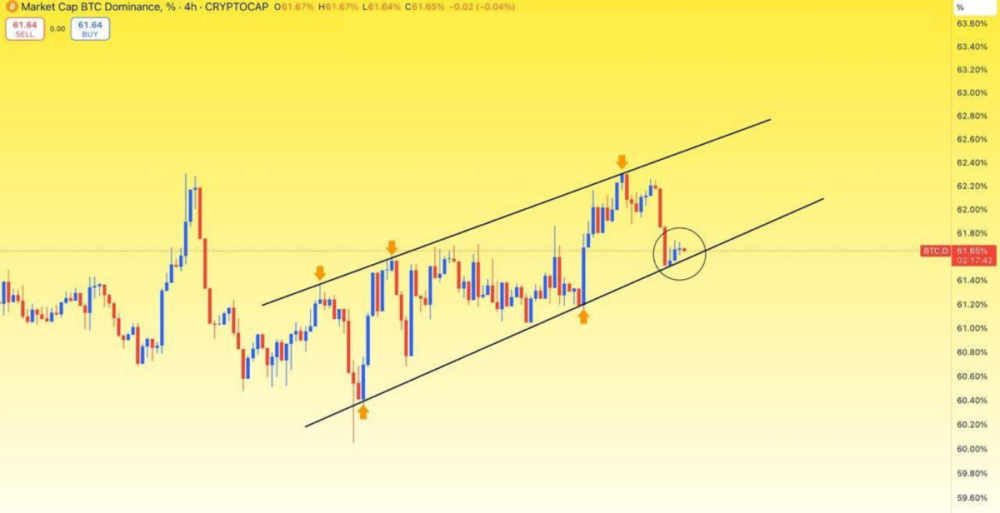
Bitcoin Dominance Analysis (4H) 📊 🔸 The chart represents Bitcoin Dominance (BTC.D) on the 4-hour timeframe, showing the percentage of total crypto market capitalization held by Bitcoin. This is crucial for understanding capital flows between Bitcoin and altcoins. 🔹 Ascending Channel Structure: The price has been following an ascending channel with multiple touches on both support and resistance lines (marked by orange arrows). The dominance tested the upper resistance several times before getting rejected. The most recent move saw a breakdown from the mid-range level, moving towards the lower support of the channel. 🔹 Current Market Outlook: The price is currently interacting with the lower boundary of the channel (circled area). A bounce from this level could indicate a continuation of the uptrend within the channel. However, a break below the channel would signal a shift in market structure, potentially leading to a decline towards 61.40% or lower levels. 🔹 Potential Scenarios: ✅ Bullish Case: If BTC dominance holds this support level and bounces back, we might see another attempt towards 62.80%-63.00% resistance levels. This would suggest Bitcoin gaining strength over altcoins. ❌ Bearish Case: If BTC.D breaks below the support zone, dominance could decline further, allowing altcoins to gain market share, potentially leading to a stronger altcoin season. 🔹 Conclusion: Keep an eye on the support level at 61.50%. A rejection from the resistance zone or breakdown from the trend channel will determine the next major move. 🚀 What’s your strategy? Will Bitcoin continue to dominate, or is it time for altcoins to shine? Let’s discuss in the comments! 👇👇 #Bitcoin #Crypto #BTCDominance #Altcoins #CryptoTrading #MarketAnalysis
-
🎁FREE SPOT TRADING SIGNAL #REVA/USDT
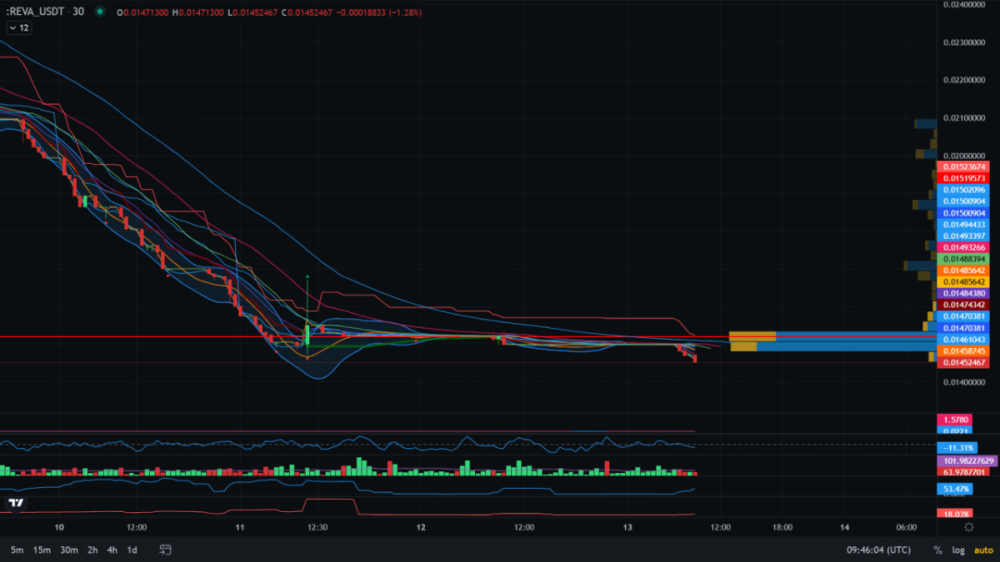
SPOT Trading signal Entry level 0.014713 Profit Targets 1-) 0.0179 2-) 0.0281 3-) 0.0325 4-) 0.0462 5-) 0.0544 6-) 0.0762 7-) 0.0899 8-) 0.1026 Stop Level 0.002458 SHORT-TERM INCREASE EXPECTED


.thumb.png.fbfad28c764ccd71ae2424c00c6f9c06.png)
.thumb.png.54bd3d4ca9994b3041b1fa864e30a143.png)
.thumb.png.0a11158286d9f3644d5a719d429872a1.png)
.thumb.png.6bbf17ebc361ed5d1725a0657fedc3b0.png)
.thumb.png.2e91a266af5ea69cb40437b56ab26a3c.png)
.thumb.png.ef0820f6f133103b43a88ba76b906ba8.png)
.thumb.png.e7fd6e28c4fdb5e93ef2afae5830efc6.png)
